
An Exploration of The 10 Markers of Metabolic Health™ used at Combe Grove. Written by Dr Rebecca Hiscutt PhD.
At Combe Grove we are passionate about Metabolic Health because it allows people to address the underlying causes of their health concerns and provides a way of reversing factors and improving health. Metabolic Health can always be improved, often dramatically and rapidly. Thus providing great hope to people who have been struggling with poor health.
To gain an understanding of a client’s current Metabolic Health we utilise a comprehensive set of biomarkers that provide a holistic understanding of their metabolic profile. This is a snapshot of how an individual’s body is functioning at that time and indicates how well they are able to maintain homeostasis or balance.
At the beginning of each client’s journey with Combe Grove they will have a Metabolic Health check with one of our clinical team. Clients will receive health results showing their assessments across the 10 Markers of Metabolic HealthTM, our robust panel of ten distinct markers. These markers encompass a range of anthropometric, functional, and biochemical parameters, each contributing unique insights into the intricate dynamics of metabolic function.
Throughout their Metabolic Health Journey each client has the opportunity to have their Metabolic Health Markers re-assessed allowing them to see the impact of the important changes they are making across the 5 Roots of Metabolic HealthTM. This important biofeedback provides visibility of how their body is functioning and with this accountability, helping to inspire further change and allow their personalised programme to be refined to help them make the greatest change possible across their 10 Markers of Metabolic HealthTM.
Here we explore the 10 Markers of Metabolic HealthTM used at Combe Grove. If you are curious about your Metabolic Health then waist to height ratio is an excellent marker to give you an indicator of your current Metabolic Health status. Instructions are provided below so you can measure this at home, even without a tape measure. What does your waist circumference say about your Metabolic Health?
The 10 Markers of Metabolic Health™ – A Comprehensive Overview
- Waist to Hip Ratio
Waist to height ratio (WHR) is an anthropometric measure calculated by dividing waist circumference by height. It serves as an indicator of abdominal fat distribution, which is strongly associated with metabolic risk (1).
Elevated WHR values are indicative of increased visceral adiposity, a known risk factor for insulin resistance and Metabolic imbalance increasing risk of chronic conditions such as cardiovascular disease, and type 2 diabetes mellitus (2).
Maintaining a healthy WHR helps to maintain Metabolic Health which helps improve everyday wellbeing: providing benefits such as stable energy, better sleep, fewer aches and pains. It also reduces the risk of chronic conditions associated with poor Metabolic Health such as cardiovascular disease, dementia and some types of cancer.
WHR values
If your waist is 80cm and you are 160cm tall, you would calculate your result like this: 80 divided by 160, which equals 0.5.
A waist-to-height ratio of 0.5 or higher is considered to increase metabolic risk.
Assessing WHR without a tape measure
You will need a piece of string or wool.
Measure your height with the string, then fold the string in half and wrap it around your waist. If the string doesn’t meet, or there’s overlap, your waist to height ratio is likely to be above 0.5.
- Blood Pressure
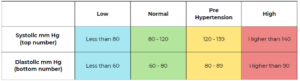
Blood pressure refers to the force exerted by blood on the artery walls. While low blood pressure may cause dizziness, untreated high blood pressure can lead to severe cardiovascular issues. It is measured in millimeters of mercury (mmHg) and comprises systolic and diastolic components.
Elevated blood pressure, or hypertension, is a major risk factor for cardiovascular disease, stroke, and kidney disease (3). It is often associated with insulin resistance, and inflammation, which contribute to metabolic imbalance
The good news is that, for many of us, making lifestyle changes can optimise our blood pressure, leading to improved health outcomes.
Blood Pressure Stages
- Weight
Weight is a measure of a persons total body mass, expressed in kilograms (kg) in the UK.
While weight alone provides limited information about body composition, it serves as a general indicator of overall health status. At Combe Grove we prioritize how weight is distributed by combining this marker alongside those of body composition such as visceral fat, muscle mass and WHR.
Achieving and maintaining a healthy weight can lead to improved health and wellbeing.
- Visceral Fat
Visceral fat is the fat that is surrounds the vital organs in the abdominal cavity. Research shows that even if your weight and body fat remain consistent, the distribution of fat changes as we age and is more likely to accumulate in the abdominal area, particularly post-menopause in women (4).
Excess visceral fat accumulation is a strong predictor of metabolic dysfunction. Visceral fat secretes pro-inflammatory molecules such as cytokines and adipokines, which contribute to insulin resistance, unhealthy levels of fat in the blood, and chronic inflammation (5).
Ensuring you have healthy visceral fat levels will improve metabolic health and can reduce the risk of diseases such as cardiovascular disease, high blood pressure and type 2 diabetes (6).
At Combe Grove we measure visceral fat and muscle mass using an Accuniq bioelectrical impedance analyser which correlates highly to the clinically used DEXA analysis.
- Muscle Mass
Muscle mass refers to the total amount of skeletal muscle tissue in the body. Muscle mass and strength are associated with longevity (7).
Adequate muscle mass is crucial for maintaining metabolic health. Skeletal muscle is important for blood glucose control and insulin action, helping to maintain insulin sensitivity which is a key driver of metabolic imbalance.
Low muscle mass, or sarcopenia, is associated with insulin resistance, impaired glucose tolerance, and poor metabolic health (8).
Preserving and increasing muscle mass through resistance exercise and adequate protein intake is essential for optimising metabolic function.
- Sit-to-Stand Test
Improving our strength and fitness levels can have profound positive effects on metabolic health, offering protection against various metabolic disorders and improving our overall quality of life.
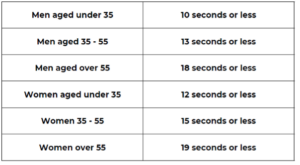
We can measure our overall strength and fitness levels by doing the ‘sit to stand’ test’. This measures how long it takes to stand up and sit down from a chair 10 times and can help to monitor how much our fitness improves as we exercise more regularly. All you need is a hard chair and a stopwatch.
When we have good strength and fitness levels, here is how long it should take to do 10 ‘sit to stands’.
- HbA1c (Glycated Haemoglobin)
HbA1c blood test tells us the average level of glucose in our blood by measuring the amount of glucose attached to our red blood cells over a period of time. As our red blood cells have a turnover rate pf around 8-12 weeks, it is often suggested to check HbA1c levels at three month intervals to an overview of the impact of lifestyle changes.
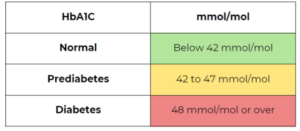
Elevated HbA1c levels are indicative of poor blood glucose control and are diagnostic of prediabetes and diabetes mellitus.
Maintaining optimal HbA1c levels is essential for preventing the development and progression of diabetes and related complications.
HbA1c can indicate people with prediabetes and diabetes as follows.
- Triglycerides
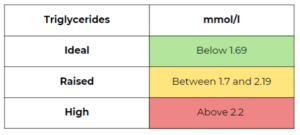
Triglycerides are a type of lipid in the blood that serve as a major source of energy.
Elevated triglyceride levels are associated with insulin resistance and imbalanced metabolic health, and increased risk of cardiovascular disease (9).
Maintaining healthy triglyceride levels is crucial for reducing the risk of heart disease and improving overall metabolic function.
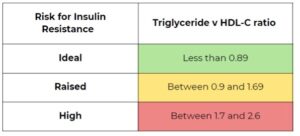
- Triglycerides-to-HDL Cholesterol Ratio (TG/HDL-C)
The triglyceride to HDL cholesterol ratio (TG/HDL-C) is calculated by dividing triglyceride levels by HDL-C levels.
This ratio provides valuable information about the balance between pro-atherogenic (contributes to the forming of plaque in the arteries) and anti-atherogenic particles in your blood. Elevated TG/HDL-C ratios are associated with increased risk of insulin resistance, metabolic imbalance and cardiovascular disease (10).
Optimising ratio of triglyceride to HDL-cholesterol ratio is essential for reducing the risk of cardiovascular events and promoting metabolic health.
- Quality of Life Score
Quality of life score is a metric used to assess a persons overall wellbeing across different categories such as social relationships, physical health and personal circumstances.
It is important to recognise that individuals with poor metabolic health often experience significantly lower quality of life scores in multiple areas, impacting their physical and mental well-being. This emphasises the importance of supporting and managing metabolic health in order to enhance overall well-being.
Conclusion
At Combe Grove, we believe that a comprehensive assessment of metabolic health requires the integration of these 10 key Markers of Metabolic HealthTM. By evaluating these parameters in unison, we can gain a deeper understanding of a client’s metabolic profile, identify areas for improvement, and develop personalised interventions to optimise their health and wellbeing. Regular monitoring of these markers is essential for preventing metabolic diseases and promoting a higher quality of life.
References
- Yoo EG. Waist-to-height ratio as a screening tool for obesity and cardiometabolic risk. Korean J Pediatr. 2016;59(11):425-431. doi:10.3345/kjp.2016.59.11.425
- Darsini D, Hamidah H, Notobroto HB, Cahyono EA. Health risks associated with high waist circumference: A systematic review. J Public Health Res. 2020;9(2):1811. Published 2020 Jul 2. doi:10.4081/jphr.2020.1811
- Fuchs FD, Whelton PK. High Blood Pressure and Cardiovascular Disease. Hypertension. 2020 Feb;75(2):285-292. doi: 10.1161/HYPERTENSIONAHA.119.14240. Epub 2019 Dec 23. PMID: 31865786; PMCID: PMC10243231.
- Fenton A. Weight, Shape, and Body Composition Changes at Menopause. J Midlife Health. 2021;12(3):187-192. doi:10.4103/jmh.jmh_123_21
- Hardy OT, Czech MP, Corvera S. What causes the insulin resistance underlying obesity?. Curr Opin Endocrinol Diabetes Obes. 2012;19(2):81-87. doi:10.1097/MED.0b013e3283514e13
- Yang SW, Kim TH, Choi HM. The reproducibility and validity verification for body composition measuring devices using bioelectrical impedance analysis in Korean adults. J Exerc Rehabil. 2018 Aug 24;14(4):621-627. doi: 10.12965/jer.1836284.142. PMID: 30276183; PMCID: PMC6165971.
- Srikanthan P, Karlamangla AS. Muscle mass index as a predictor of longevity in older adults. Am J Med. 2014;127(6):547-553. doi:10.1016/j.amjmed.2014.02.007
- Alexis Marcotte-Chénard, Barbara Oliveira, Jonathan P. Little, Darren G. Candow. Sarcopenia and type 2 diabetes: Pathophysiology and potential therapeutic lifestyle interventions,Diabetes & Metabolic Syndrome: Clinical Research & Reviews. 2023: Volume 17, Issue 9,102835
- Grundy SM. Hypertriglyceridemia, insulin resistance, and the metabolic syndrome. Am J Cardiol. 1999 May 13;83(9B):25F-29F. doi: 10.1016/s0002-9149(99)00211-8. PMID: 10357572.
- TG/HDL ratio as surrogate marker for insulin resistance. Cordero, Dr. Eduardo Alegria-Ezquerra. e-journal of Cardiology practice. Vol. 8, N° 16 – 22 Dec 2009